The annual report is frequently read in a digital format, rather than as a printed document. When we asked analysts, investors and journalists how they consume annual reports, the vast majority said they either read it as a PDF on a screen or as an online report. So, what is the best way to format reports for screen displays?
When ranking more than 900 companies in Webranking by Comprend, our annual research on corporate websites, one of the things we look at is how companies present their annual report online. Essentially, there are three ways of doing it:
- Full online annual report
- Online summary
- Interactive PDF
Before exploring these formats, it's worth noting that far too many companies today are still providing browseable annual reports that display like a magazine on screen and might even have sound effects when you turn the page. They are often called interactive online annual reports. It is difficult to read annual reports in this format as you need to zoom in to see the text, and you cannot copy text or tables which you might want to do when creating your own material.
Here are two examples from Swedish Nibe and Austrian Semperit. These types of browsable annual reports provide a terrible user experience, don’t help with accessibility or improve what the user can do with the content. They are even less usable than a PDF and they hurt more than they help. Our advice would be to not use them at all.
Online annual report
The full online annual report is provided as a microsite, with content navigation and presentation that is adapted and optimised for the online format for both desktop and mobile. This format is user friendly and easier to read on a screen. This type can also be present as a section on the corporate website, clearly marked as the annual report.
The advantage of an online report is that it can reach a larger target audience just by being available in an online format. It is easy to find information via search engines, to share specific articles, as well as the full annual report. This way, the reports get a longer life, and the content that companies spend so much time and effort on can reach more people. The online report is also accessible and readable on mobile phones, especially when compared to PDFs. Another advantage is the option to use more formats for content, such as video and interactive tables and charts.
The use of video is increasing in general, and many companies are taking the opportunity to create videos for the annual report. These often include business leaders providing their view on what the company has achieved and what they are focusing on in the future.
Regardless of whether you have a microsite or if the annual report is integrated in the corporate website, it is easy to identify how the content is being consumed by looking at user analytics.

Example of an online annual report: BASF microsite
Online summary
Every year we analyse annual reports for our ReportWatch research as well as for the Webranking scores and we see many online summaries. This is where companies provide one or more pages with content from the annual report that links to the PDF.
This is a helpful way of presenting highlights. It also motivates readers to further engage with different parts of the annual report. As with the full online reports, the summary can appeal to and reach a larger target audience than the PDF. It allows companies to be more creative with the presentation and storytelling. The best summaries do not only link to pages or sections in the PDF, but also to the corporate website where the latest information can be found.
It doesn't require a huge effort or investment to produce an online summary and it is also easier to share on digital channels instead of linking directly to the PDF.

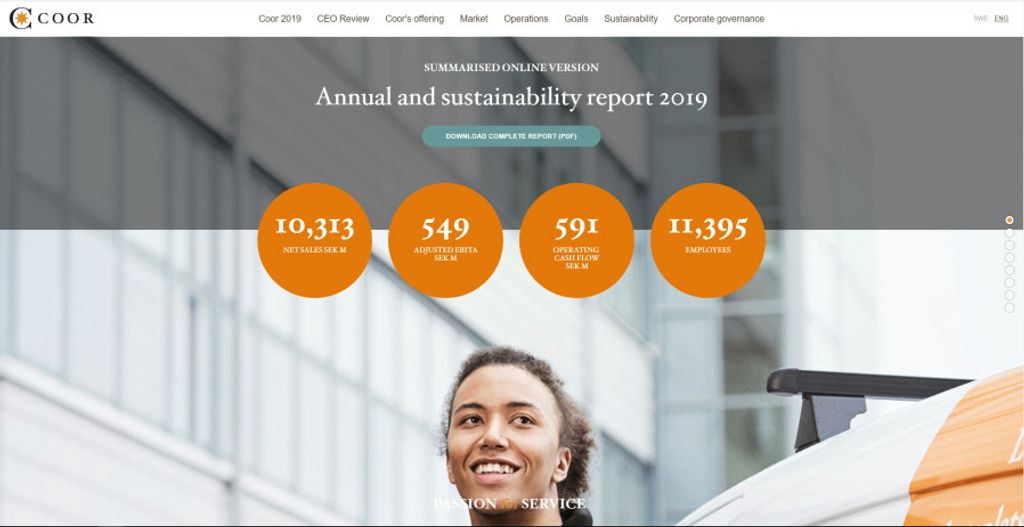
Facility management company Coor provides an online summary of their annual report. Most of the content is available directly on the homepage of the report, linking to further information. Comprend have done Coor's online summary since the annual report 2017.
Interactive or adapted PDF
73% of the respondents in our survey said they prefer to read the annual report online. That means that only a fourth prefer the printed version or printing their own copy from the PDF. The classic portrait format that most PDFs use is only suitable for a few of its readers.
A good way to cater for these users, assuming you can’t provide the full online experience, is to provide a PDF that is adapted for the screen rather than for print. This can be done by having links to the different sections of the annual report on each page, a link to the table of contents, and to provide cross links within the report and to the corporate website. It can also be helpful to present the design in a landscape rather than in portrait format.
We have seen an increased use of this from companies in Webranking by Comprend. In 2019-2020, 18% of the ranked companies provided an interactive or adapted PDF. These PDFs are good for desktop users but don't render well on mobile. However, the majority of annual report readers still read them from their computers.
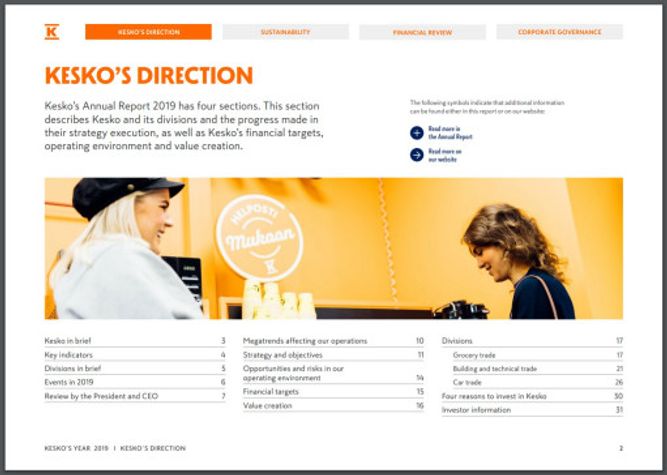
The Finnish retail company Kesko has an annual report in a landscape format. The PDF has links to each section in the top, links on each section landing page and links throughout the report, making it easy to go back and forth between sections.

Kesko's annual report 2019 - a PDF in landscape format, with links
What's the right format?
The method you choose should depend on who your target group is. An online format gives you the opportunity to work more actively with the distribution part of your annual corporate communication. Reaching your audience includes sharing or promoting the annual report content on social media, on search and across your digital touchpoints.
To reach a larger target group, engage your audiences and make the most of your annual report, an online version, or at the very least an online summary, is highly recommended.