Global 100 fall behind in providing content for the capital market
When comparing website content aimed the capital market between European and non-European companies, the Europeans are the clear winners.
Our annual survey, Webranking by Comprend, has ranked the 100 largest companies globally based on input from the capital market [1]. Among these companies, 24 are European, 65 from the US, and only a handful from Asia. All companies have been ranked using the same criteria.
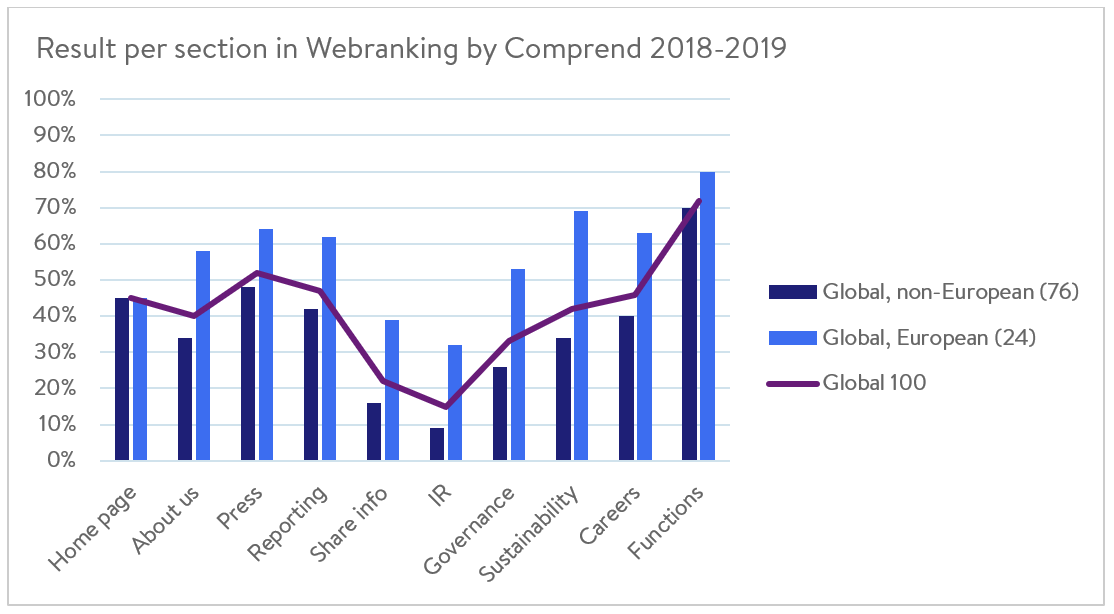
The results show that European companies are clearly outperforming their peers when it comes to providing information for the capital market and jobseekers. The average score for the 76 non-European companies was 34.3 out of a total of 100 points, while the 24 European companies scored an average of 56.1 points – an overall difference of almost 22 points.
We will explore the areas where these differences were the most prominent.
Shareholder information and investor relations
Non-European shareholder information and investor relations sections scored an average of 16 and 9% respectively, compared to 39 and 32% for European companies. This can be partly explained through country-specific regulations and procedural differences, but still demonstrates the gap in scoring between information provided by companies in Europe and the rest of the world. While the Europeans facilitate information seeking for their visitors, stakeholders to non-European companies need to rely on financial reports, media releases, databases, and external media coverage.
Company information
A topic that shouldn’t be impacted by these regional differences is the way companies describe themselves. Here, too, we can see this pattern repeating itself, with non-European companies scoring an average of 34% compared to the European companies’ 58%.
All companies struggle to present as much information on their business model as their stakeholders demand, but global companies struggle the most. The best performing non-European company in this section was United Technologies, who scored 68%, compared to the best European performer, Total, with a score of 78%.
Sustainability - not a priority outside of Europe?
The largest difference between the European and non-European companies lies within sustainability, where the Europeans earned an average of 69%, while the non-Europeans scored 34%. Many of the non-European companies do present a brief description of their sustainability strategy, as well as environmental targets, but generally avoid providing more details. German SAP is a good example of accurate and clear presentation in this area.
Features and functionality
The one area where non-European companies scored just as well as the Europeans was Features and functionality, where Cisco and Caterpillar performed at the same level as the top Europeans Unilever and LVMH.
The best performers
This year, the Global 100 podium was dominated by Germany, which won the three top places.
- In third place, we have Bayer, dropping one place since last year with a score of 67.7 points.
- In second place, we have Daimler. With a score increase of 10.8 points and a final result of 71.7 points, they’ve climbed up from 6th place last year.
- This year’s winner, and no stranger to the podium, is BASF. Increasing their score by a little more than a point, they stand firm at 76.9 points.
This year’s fastest climber is new to the Global 100 list but has been a mainstay presence on the French list. French oil and gas company Total succeeded in increasing their score from 49.5 to 62.6 points, as well as becoming one of the largest companies in the world.
The best non-European company on the list was Bristol Myers Squibb, coming in 20th place with 48.5 points, followed by Coca-Cola (22nd place, 46.3 points) and 3M (23rd, 46.2 points).
Many of the largest companies in the world were included in the ranking list, with Apple on 94th place and Alphabet Inc. on 98th. Alphabet’s website consists of two pages - one including a letter from Larry Page and a page that collects reports and documents. Simple enough, but it leaves room for speculation and many stakeholders are turning to the media to find out more information instead of getting it from the company itself.
Top 20
Max score=100
| Rank | Company | Main country | Score 2018-2019 | Score 2017-2016 |
|---|
| 1 | BASF | Germany | 76.9 | 75.6 |
|---|
| 2 | Daimler | Germany | 71.7 | 60.9 |
|---|
| 3 | Bayer | Germany | 67.7 | 71.6 |
|---|
| 4 | Allianz | Germany | 65.4 | 61.1 |
|---|
| 5 | SAP | Germany | 63.5 | 54.4 |
|---|
| 6 | BP | UK | 63.1 | 56.4 |
|---|
| 7 | Total | France | 62.6 | 49.5 |
|---|
| 8 | Novo Nordisk | Denmark | 62.5 | 52.5 |
|---|
| 9 | Roche | Switzerland | 62.4 | 62.3 |
|---|
| 10 | Nestlé | Switzerland | 61.8 | 60 |
|---|
| 11 | Unilever NV | Netherlands | 58.4 | 54.7 |
|---|
| 12 | Siemens | Germany | 57.4 | 53.8 |
|---|
| 13 | Novartis | Switzerland | 56.8 | 51.3 |
|---|
| 14 | British American Tobacco | UK | 53.8 | 51.2 |
|---|
| 15 | ASML Holding | Netherlands | 53.4 | 46.2 |
|---|
| 16 | HSBC | UK | 52.0 | 50.3 |
|---|
| 17 | Royal Dutch Shell | UK | 51.8 | 57.5 |
|---|
| 18 | BNP Paribas | France | 51.5 | 51.3 |
|---|
| 19 | Sanofi | France | 50.8 | 50.3 |
|---|
| 20 | Bristol Myers Squibb | US | 48.5 | 40.2 |
|---|
See the Global 100 results
[1] The survey is primarily created from a European perspective, but respondents in the Capital Market survey (which forms the basis for the Webranking criteria) also cover Asia, the Asia Pacific, North and South America.